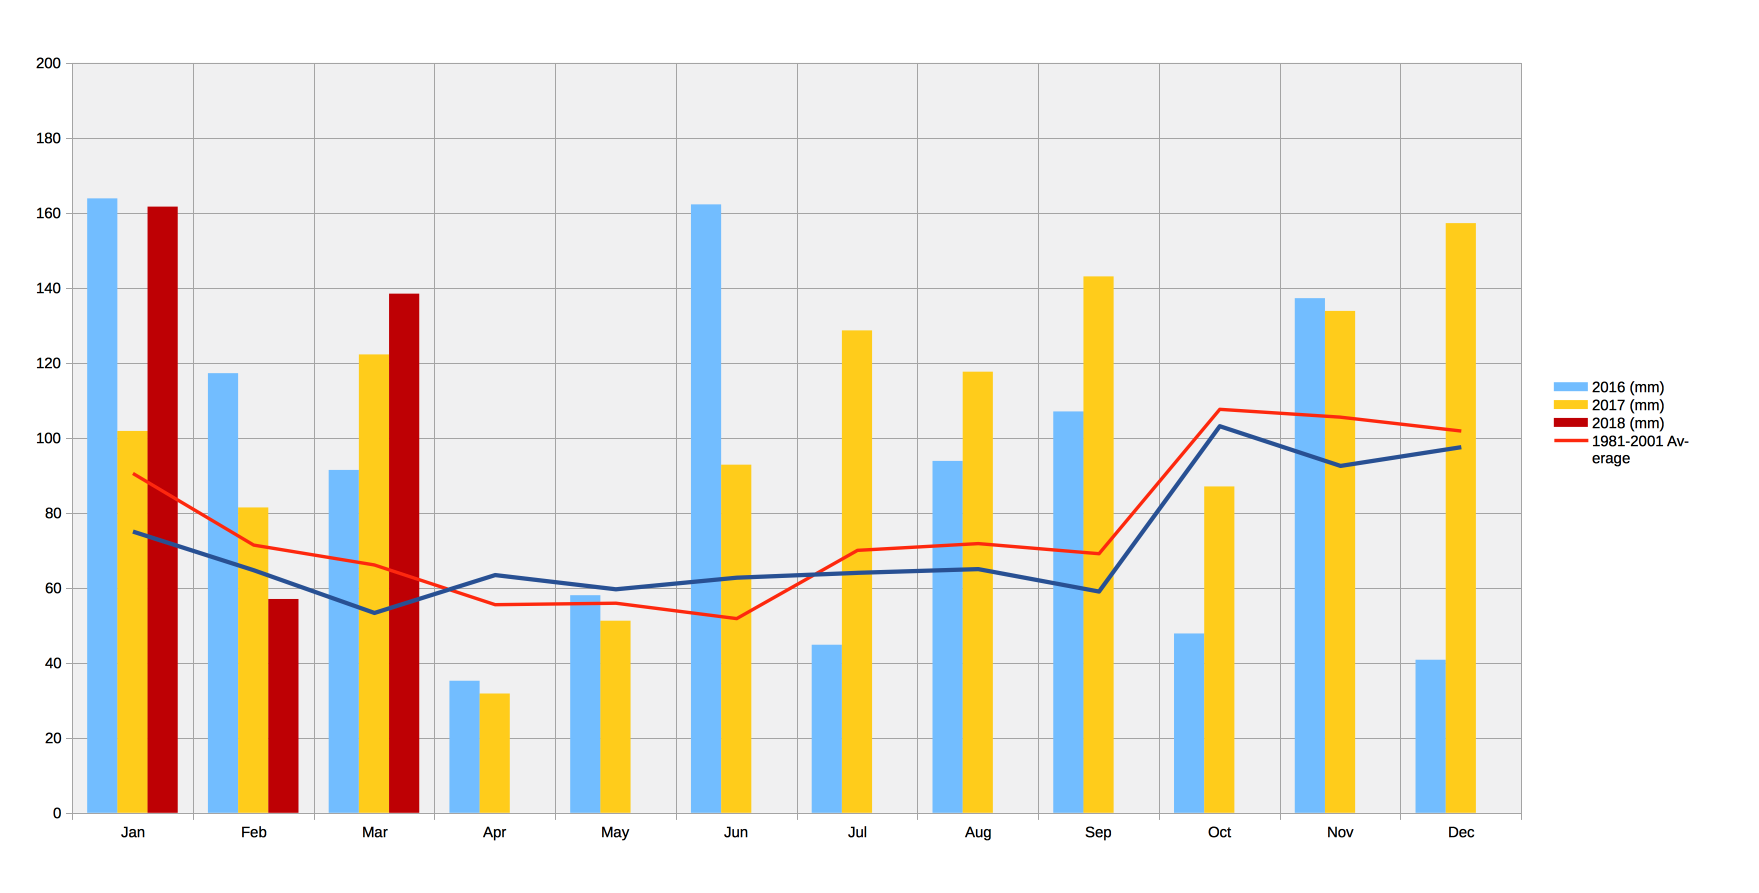
The first three months of 2018 have been distinctly wet, with a total of 357mm of rain, amounting to 185% of the 2000-12 average. The graph below shows the pattern.
 January
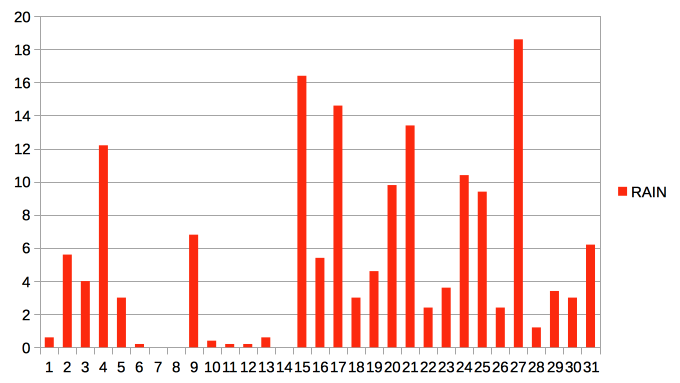
 Total rainfall for January was 161.6mm, or 215% of the 2000-12 average. As the graph shows, the middle of the month was dry, but heavy rain from the 15th on accounted for the high total.
February
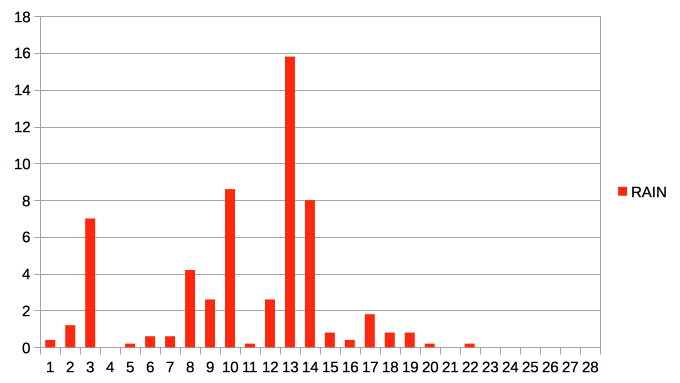
 February was drier than average, with only 57mm of rain, or 88% of the average. The last 10 days of the month were notably dry – a hosepipe ban looked like a real possibility!
March
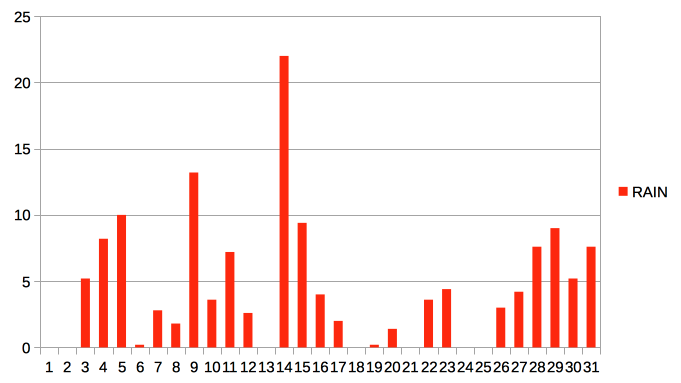
 March more than compensated for February’s low rainfall, with 138mm of rain, or 259% of the average. Most marked was the 14th of the month, when 22mm of rain fell in 24 hours.