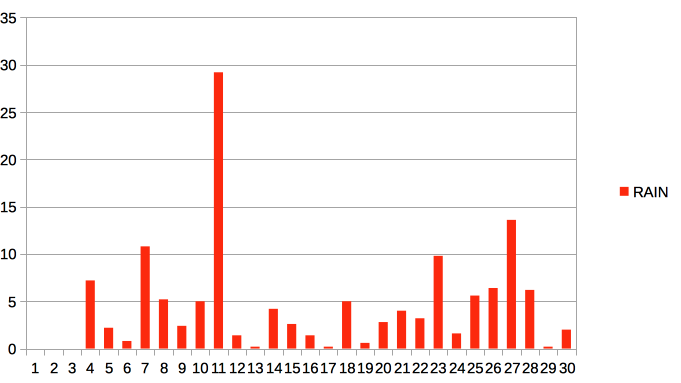
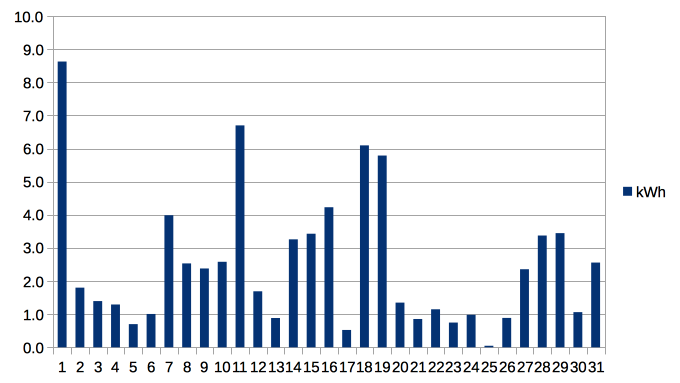
November’s solar power generation was, as expected, down on the summer months, even on clear days.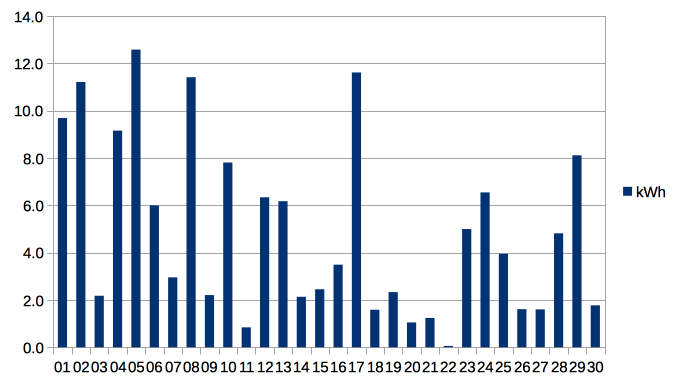 Note, though, a few days when the panels generated 2kWh or less – a dull, cloudy month. The total for November was 148kWh.
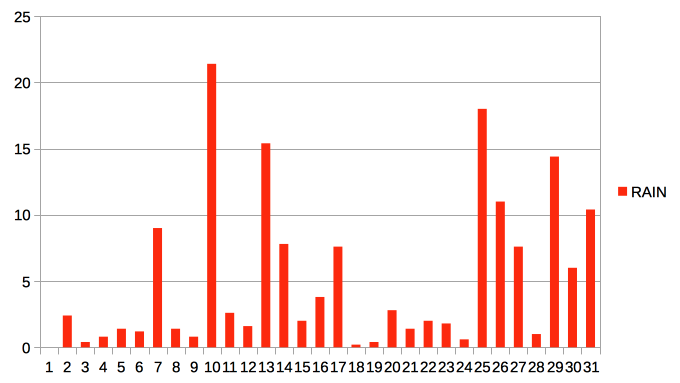
December was no better, even allowing for the expected fall as the solar elevation falls.
 The total for December was 78kWh.
The annual picture, below, is broadly in line with the pattern predicted from the solar elevation. There is no data for January, and February’s result is low, as the panels were installed in late February.
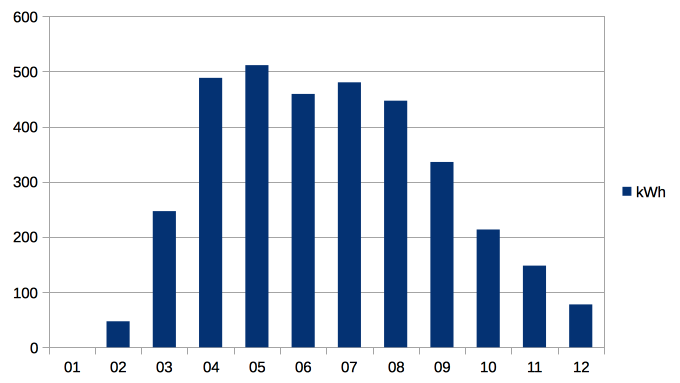 Total for the year was 3454kWh.