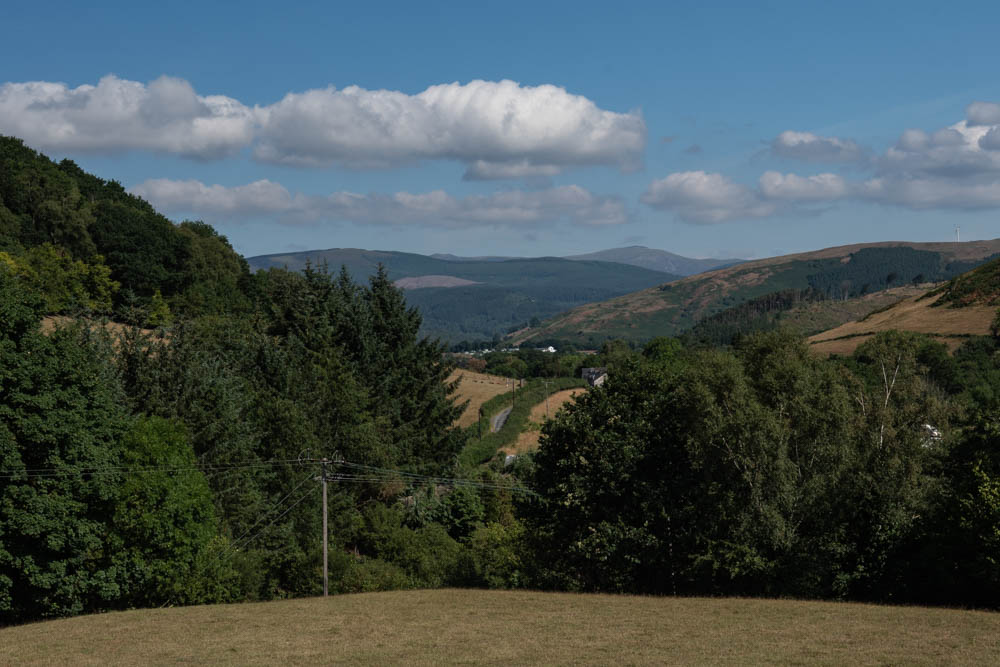
I’ve just added a new gallery to my website, containing photographs of a recent trip to Wales. You can find it here.
I’ve just added a new gallery to my website, containing photographs of a recent trip to Wales. You can find it here.
I’ve just added four new galleries to my website, containing pictures from our recent trip to Scotland. You can find them at:
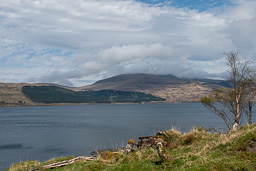 |  |
| Pictures of Mull | Pictures of Iona |
 | 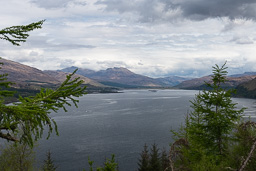 |
| Pictures of Skye | Pictures of the Highlands |
Jan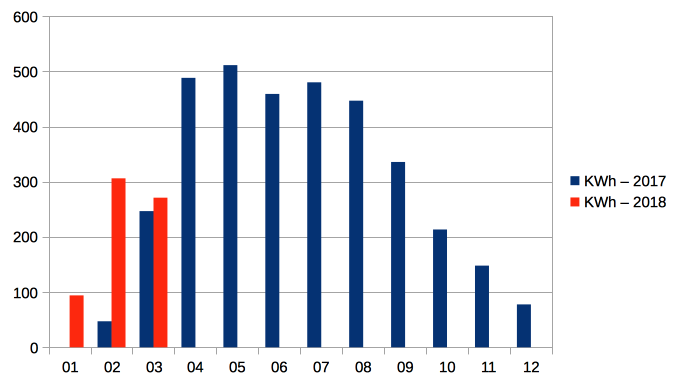 Our solar panels have generated 671kWh in the first three months of the year, reasonably consistent with the expected annual profile.
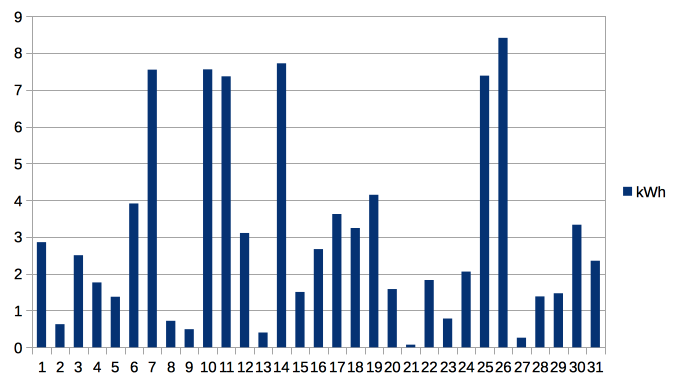 January was patchy, with a few reasonable days. We have no comparison with previous years for the monthly total of 94kWh, as the system was not installed until February 2017.
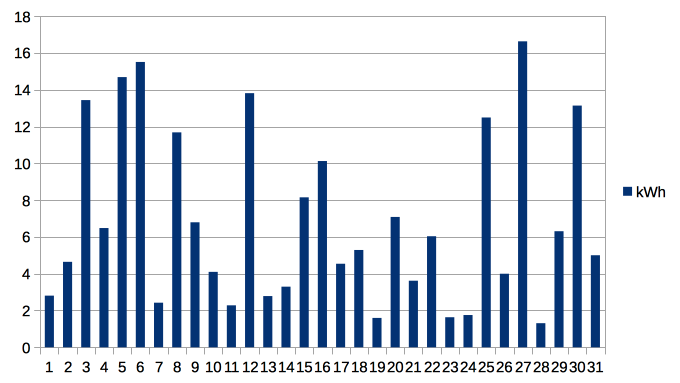
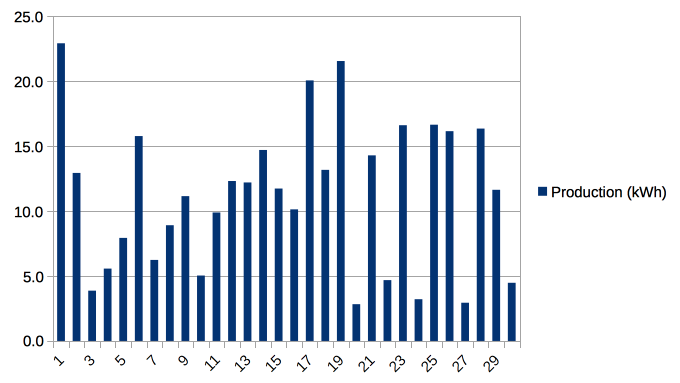
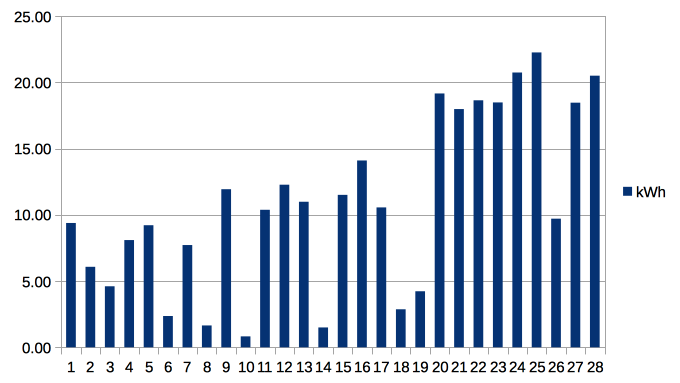 The latter half of February in particular was sunny, contributing to a monthly total of 306kWh, with several days over 20kWh. Again, no year-on-year comparison is possible.
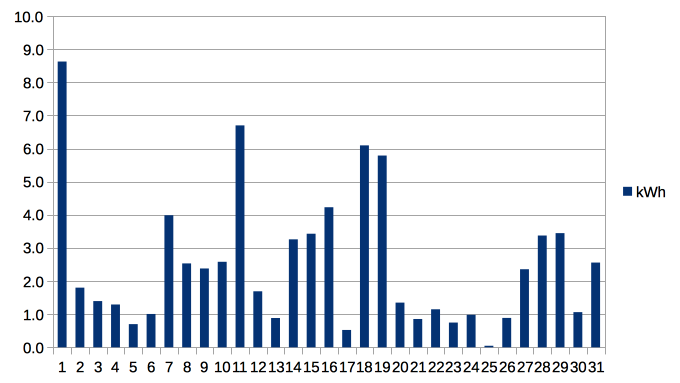
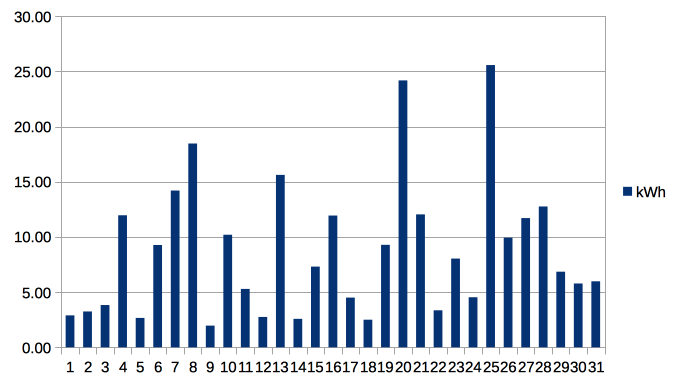 The total for March was 271kWh, slightly greater than March 2017. A few good days, including one at more than 25kWh helped.
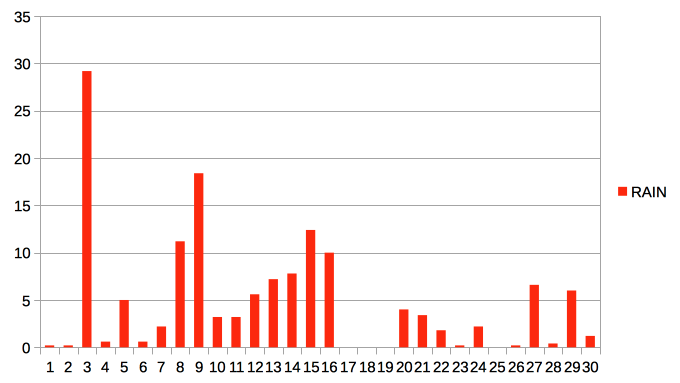
The first three months of 2018 have been distinctly wet, with a total of 357mm of rain, amounting to 185% of the 2000-12 average. The graph below shows the pattern.
 January
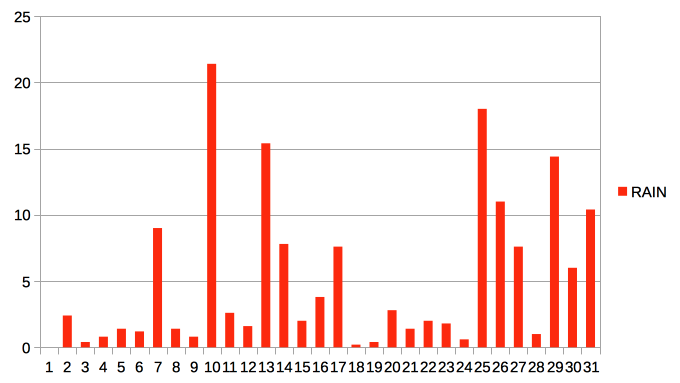
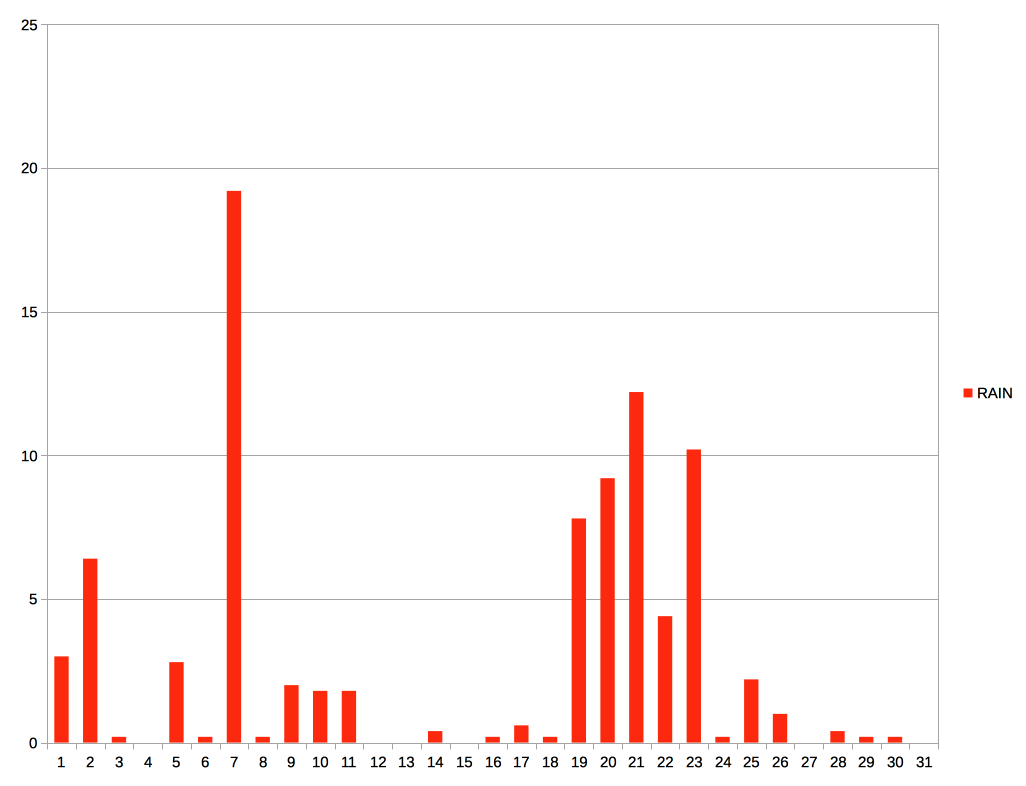
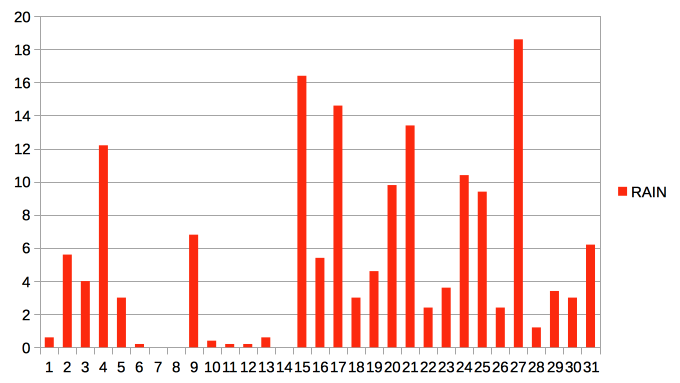 Total rainfall for January was 161.6mm, or 215% of the 2000-12 average. As the graph shows, the middle of the month was dry, but heavy rain from the 15th on accounted for the high total.
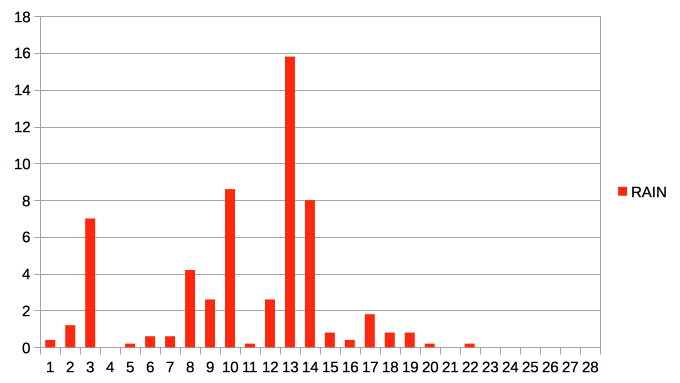 February was drier than average, with only 57mm of rain, or 88% of the average. The last 10 days of the month were notably dry – a hosepipe ban looked like a real possibility!
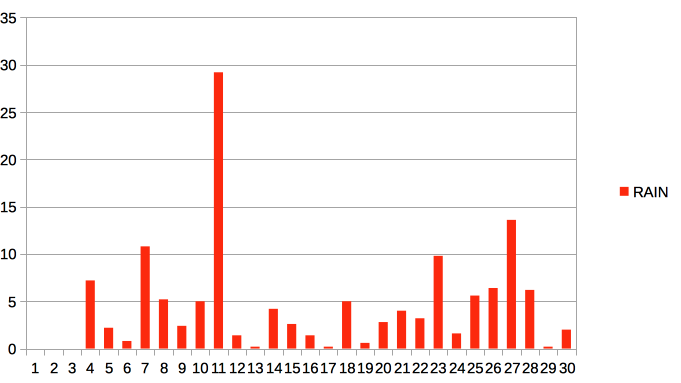
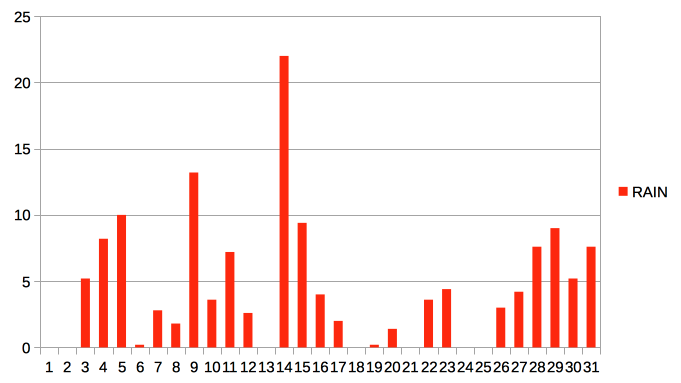 March more than compensated for February’s low rainfall, with 138mm of rain, or 259% of the average. Most marked was the 14th of the month, when 22mm of rain fell in 24 hours.
November’s solar power generation was, as expected, down on the summer months, even on clear days.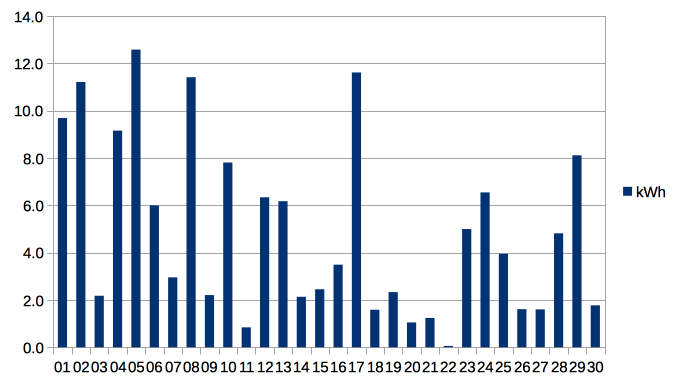 Note, though, a few days when the panels generated 2kWh or less – a dull, cloudy month. The total for November was 148kWh.
December was no better, even allowing for the expected fall as the solar elevation falls.
 The total for December was 78kWh.
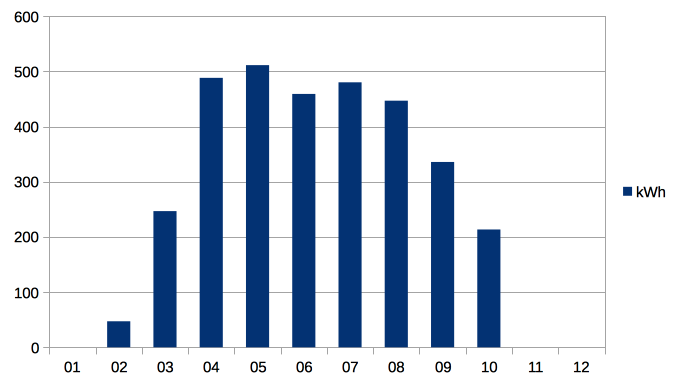
The annual picture, below, is broadly in line with the pattern predicted from the solar elevation. There is no data for January, and February’s result is low, as the panels were installed in late February.
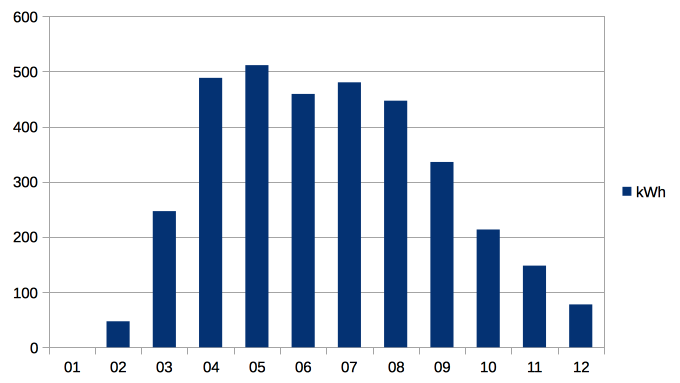 Total for the year was 3454kWh.
A little late in the day (or very late for November), the rainfall records for November and December 2017 show still more wet months.
 Total rainfall for November was 133.8mm, 144% of the 2001-12 average, spread through the month.
 The total for December was 157.2mm, 161% of the 2001-12 aveage and nearly four times the rainfall for December 2016.
Both November and December had some very wet days, with over 10mm of rain per day.
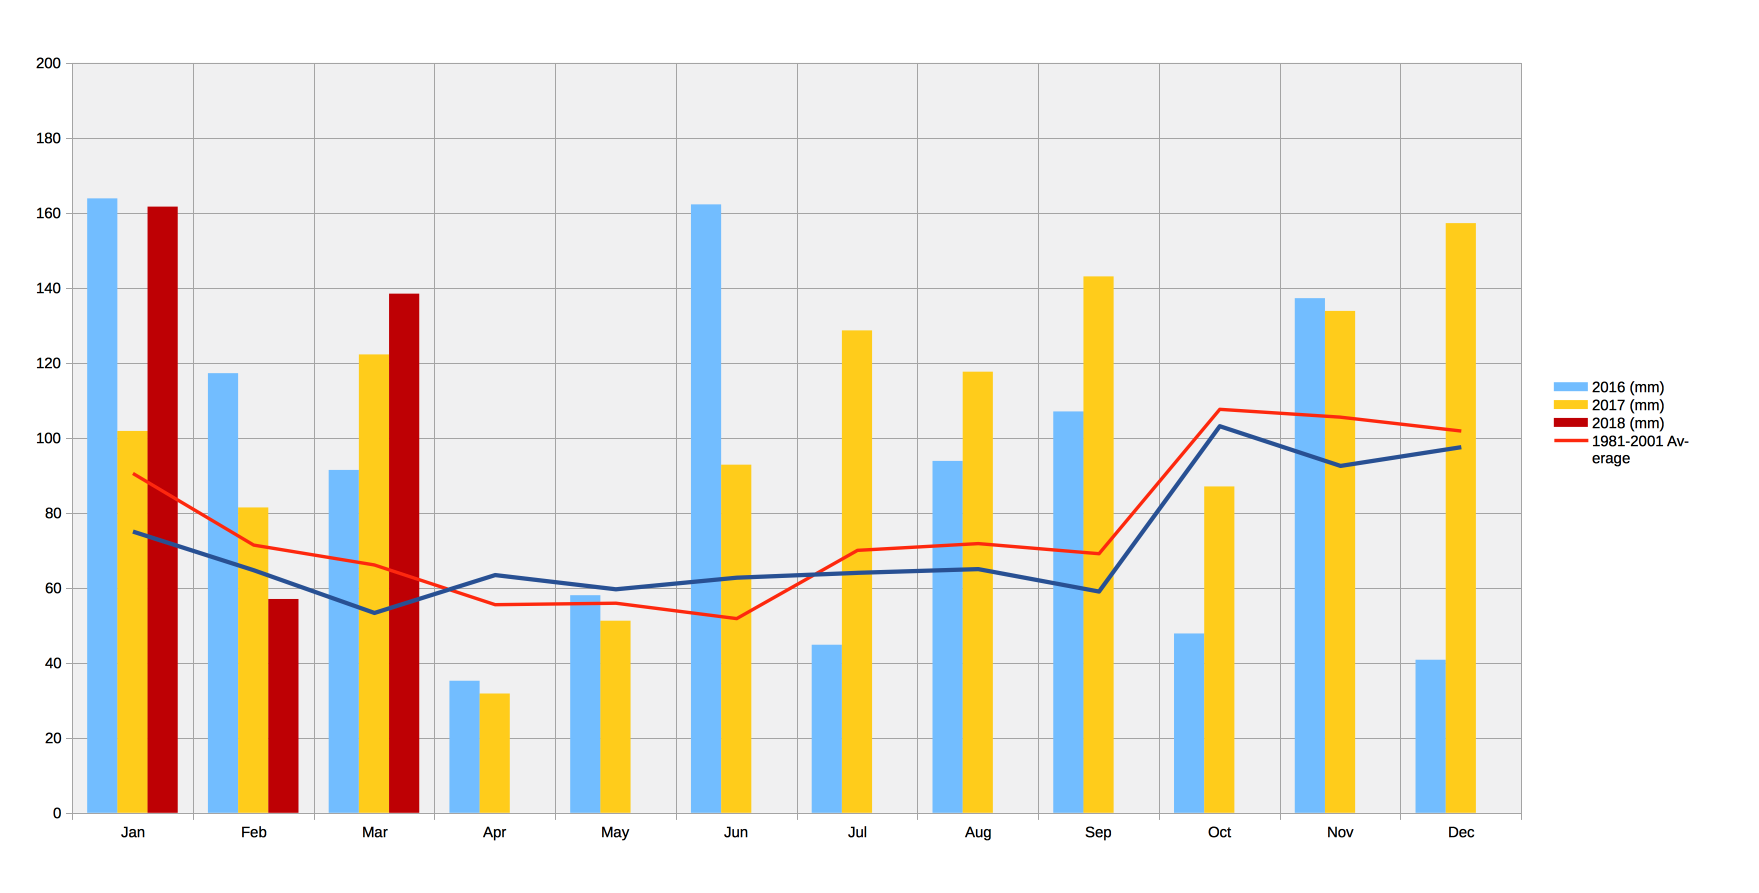
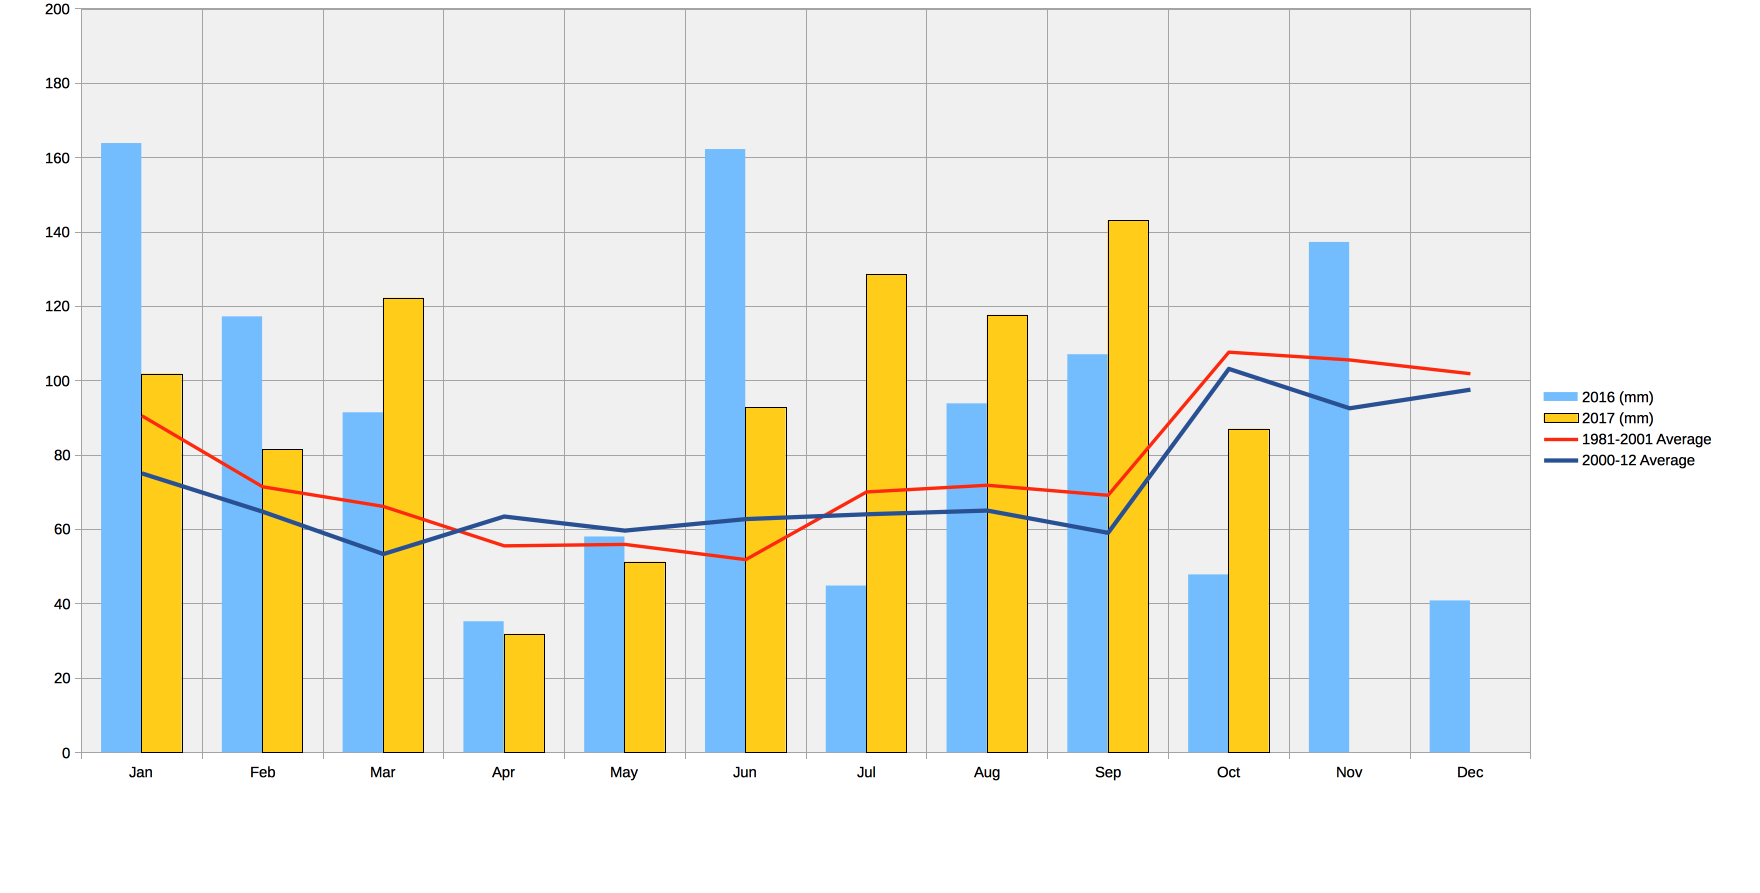
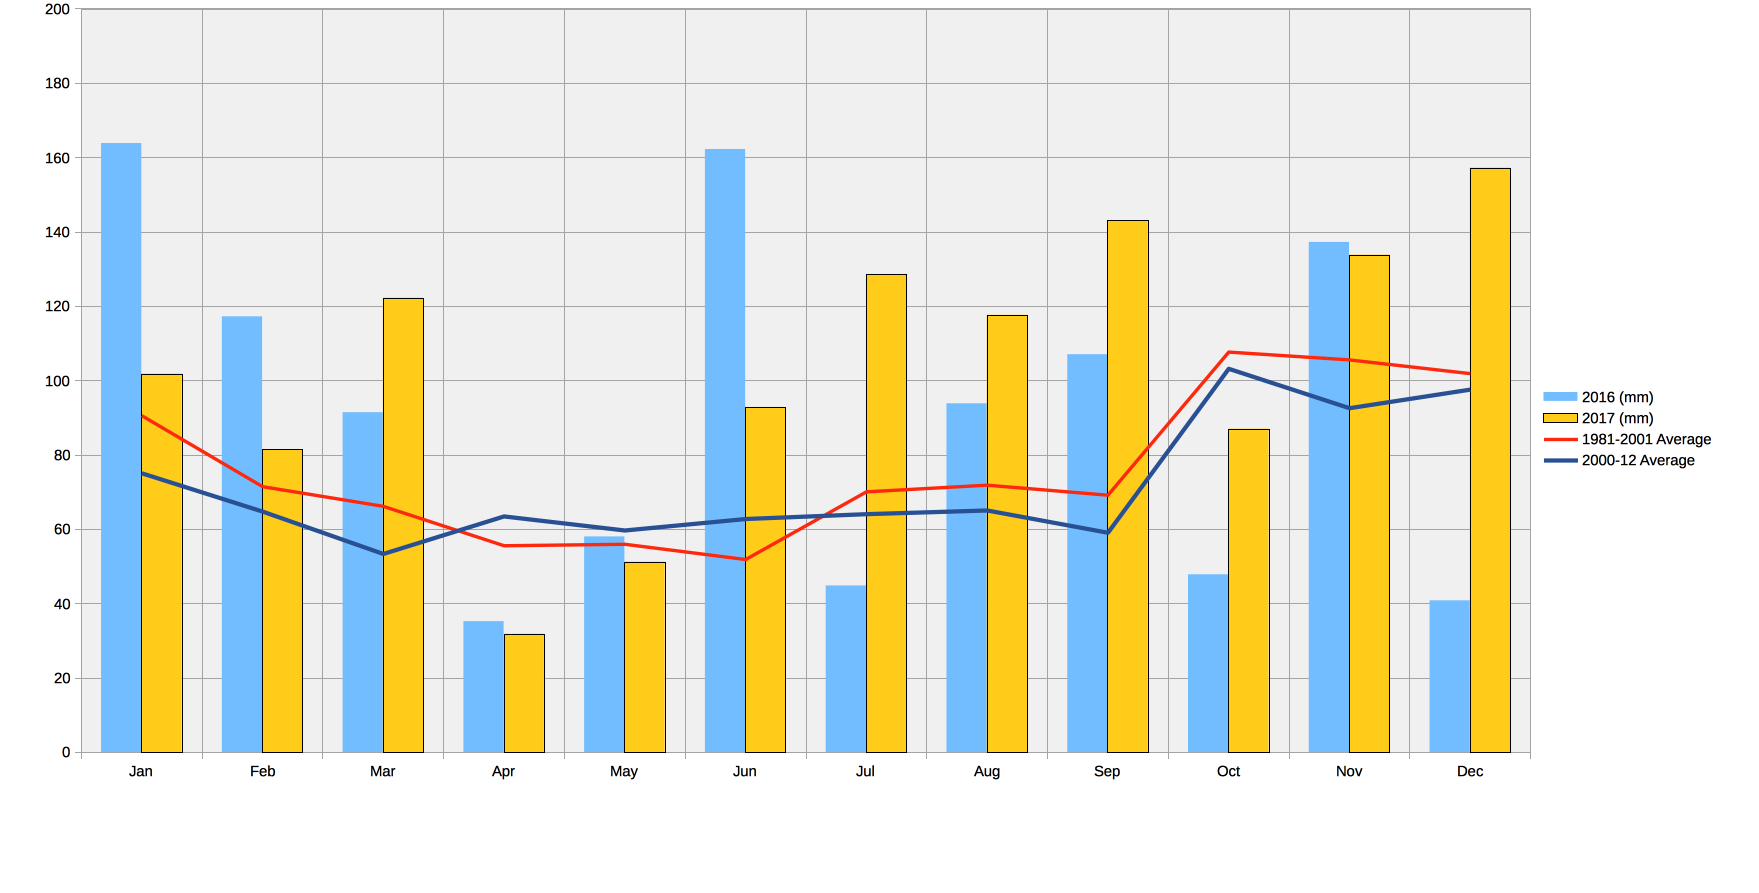 The annual summary graph shows what a wet year 2017 has been, with only three months with below average rainfall, and several months with substantially more than average.
The annual total for 2017 was 1248mm, which is 145% of the 2001-12 average.
Solar power generation is falling now, relative to the summer months, as the days shorten and the solar elevation decreases. Total generation for the month was 214kWh. The pattern for our installation is shown below:
October has not had long sunny spells, so the pattern through the month is mixed:
October was a relatively dry month, with 87mm of rainfall. This is 84% of the 2000-12 average.
 This contrasts with the last few months that have all been substantially wetter than average.
There was a wet spell around the 20th of the month, but otherwise no particular pattern. The high rainfall on 7th October was associated with Storm Brian.
 A total of 336kWh in September. This is consistent with the seasonal fall in production as the elevation of the sun decreases, though probably reduced somewhat by cloud cover – September was a very wet month.
Yet another very wet month, with 143mm of rain (242% of the 2001-12 average!). Cumulative rainfall for the year is 871mm, 153% 0f the 2001-12 average of 568mm. So a very wet year in prospect.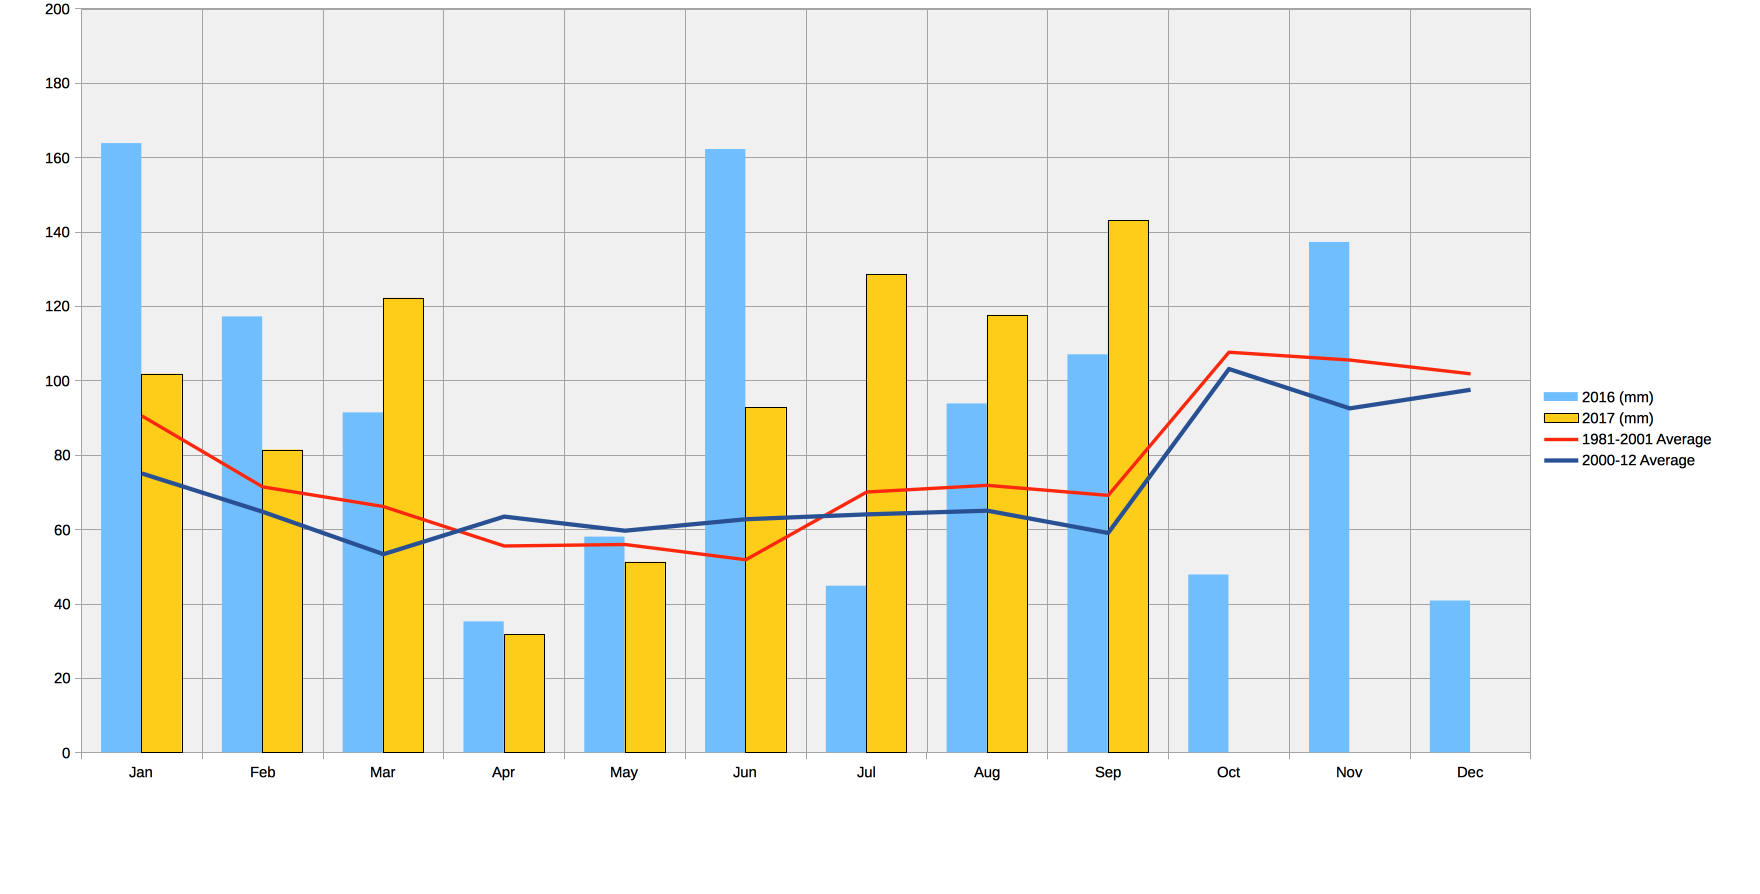 Some very wet days, 29mm on 3rd, and 18mm on 12th, but a dry few days from 17-19th.