Rainfall for January, February and March 2018

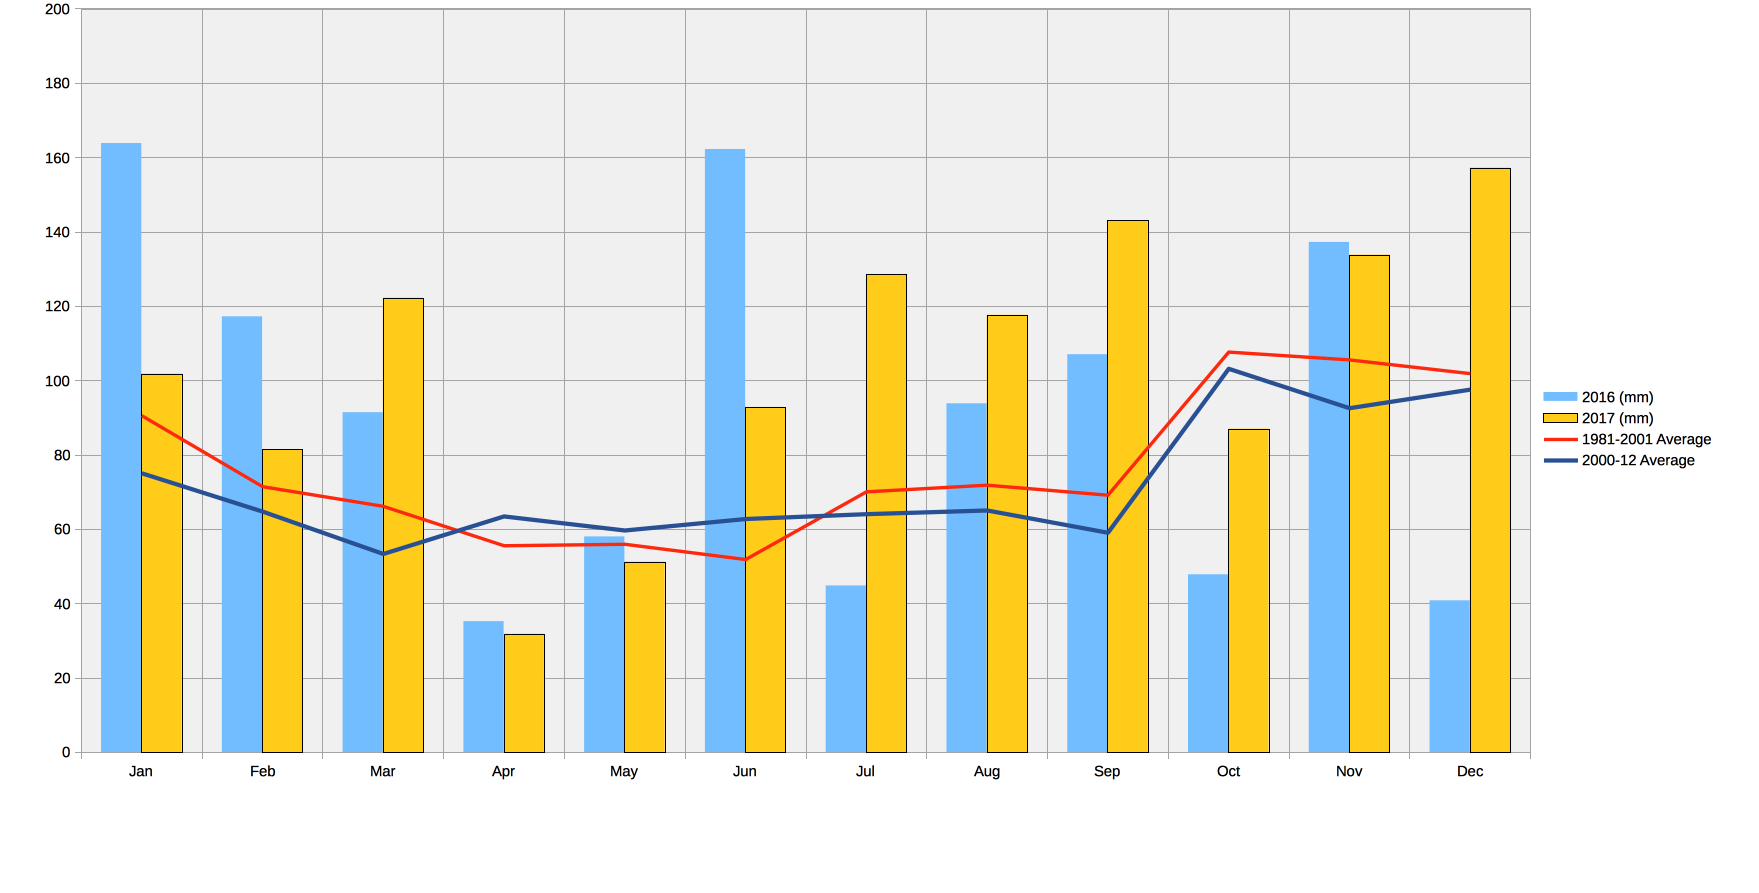
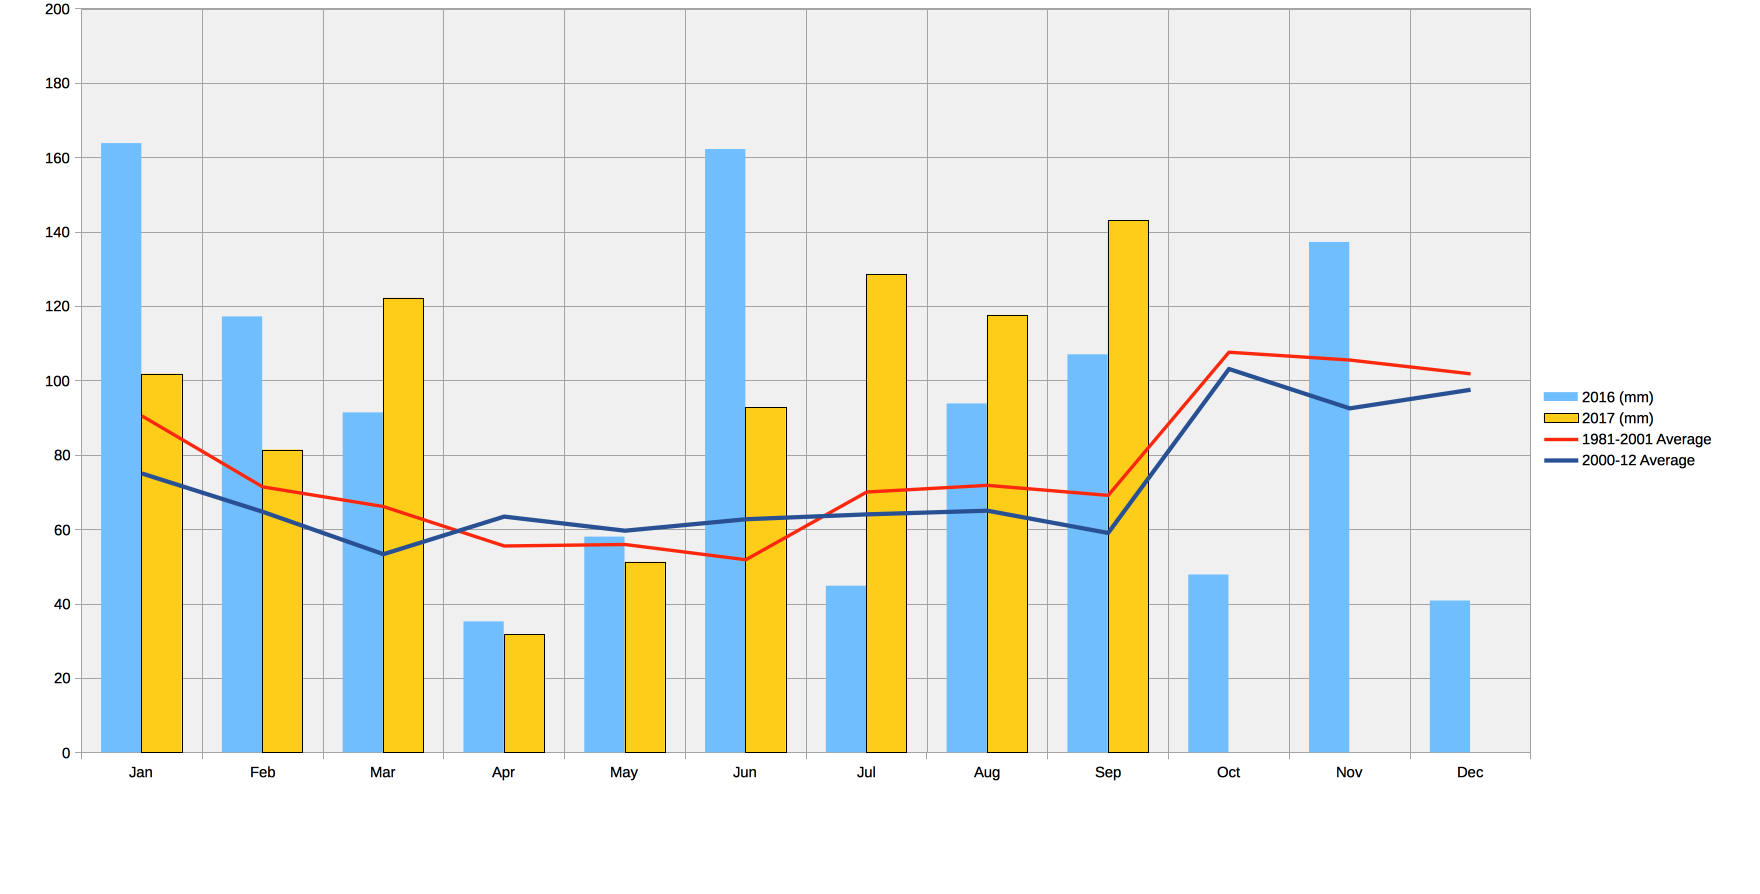
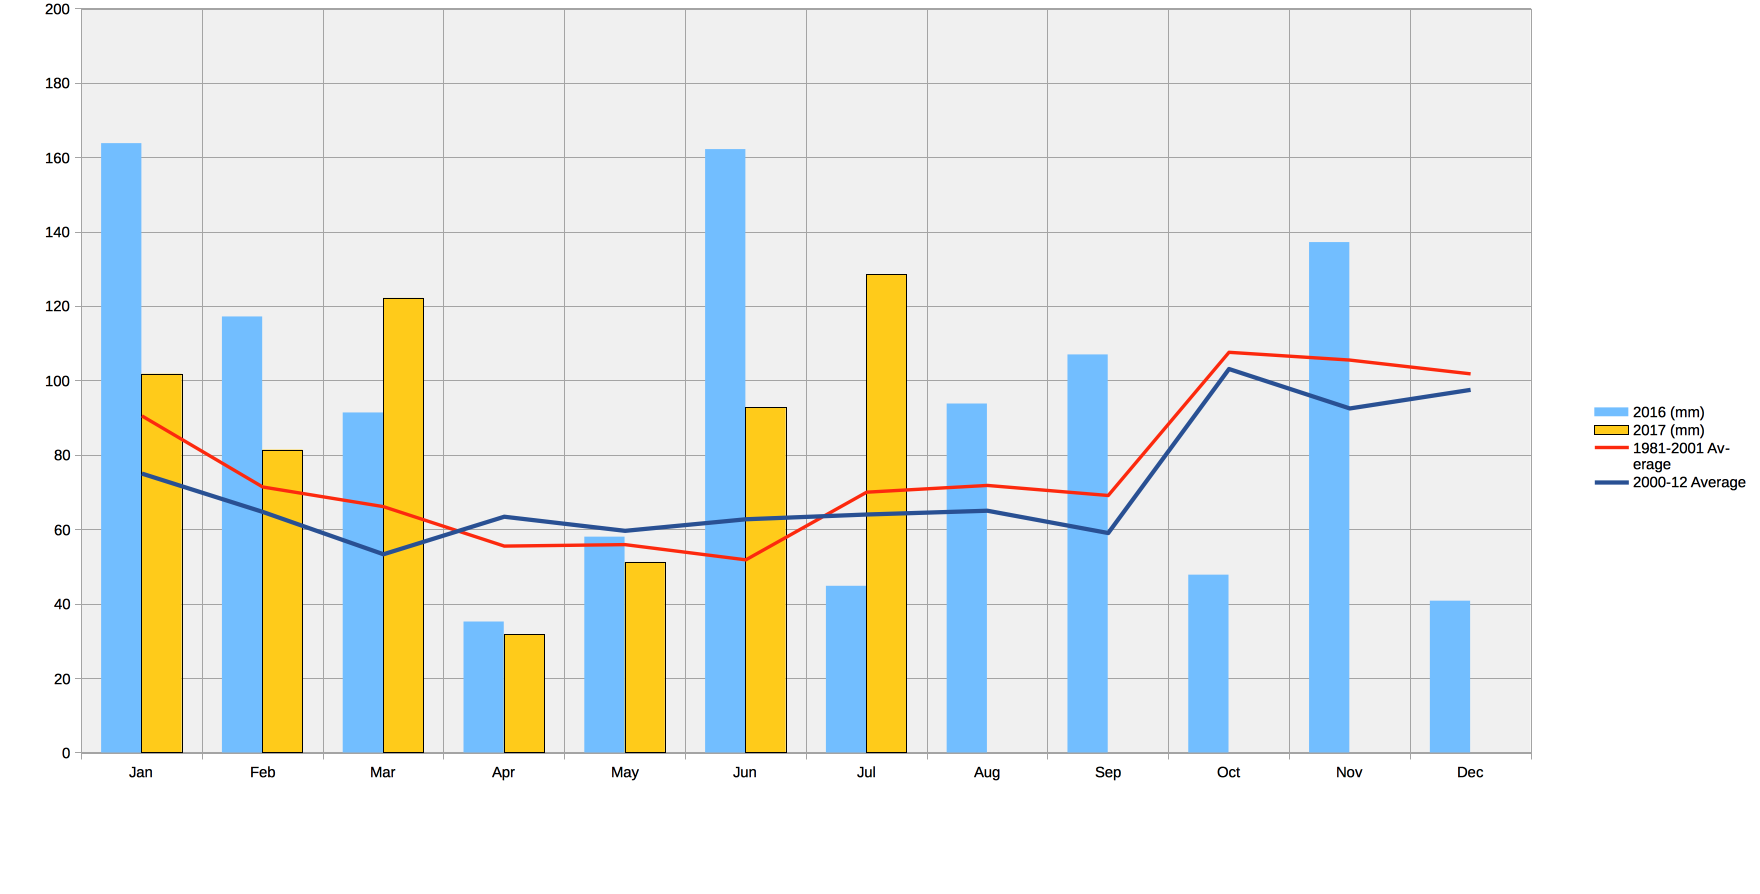
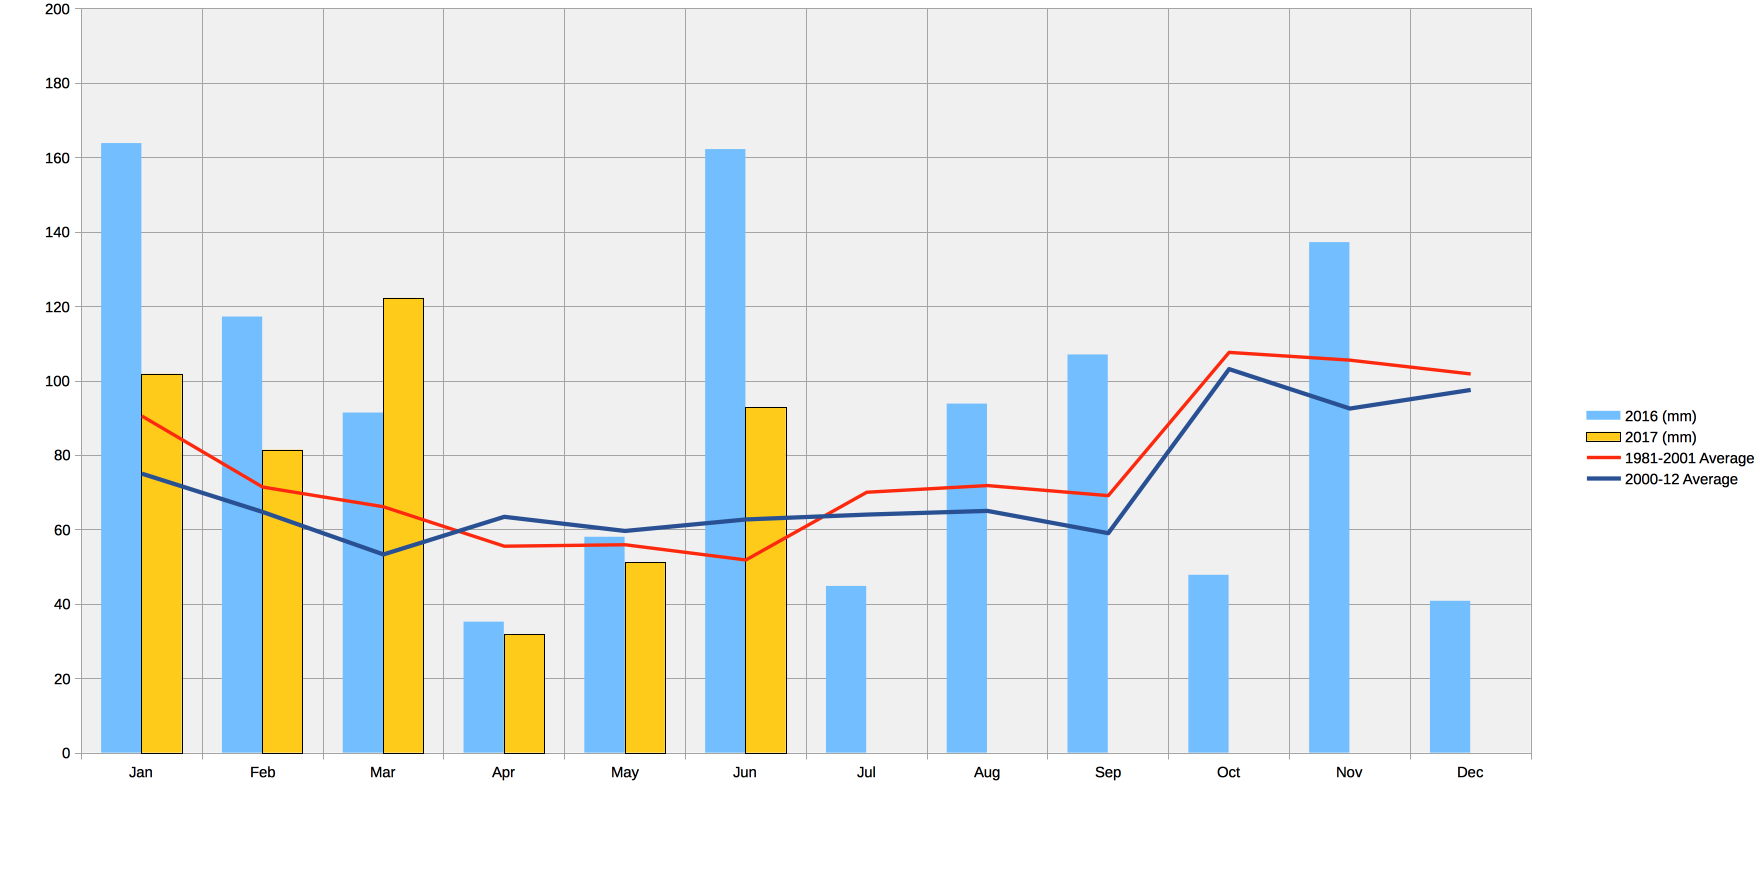
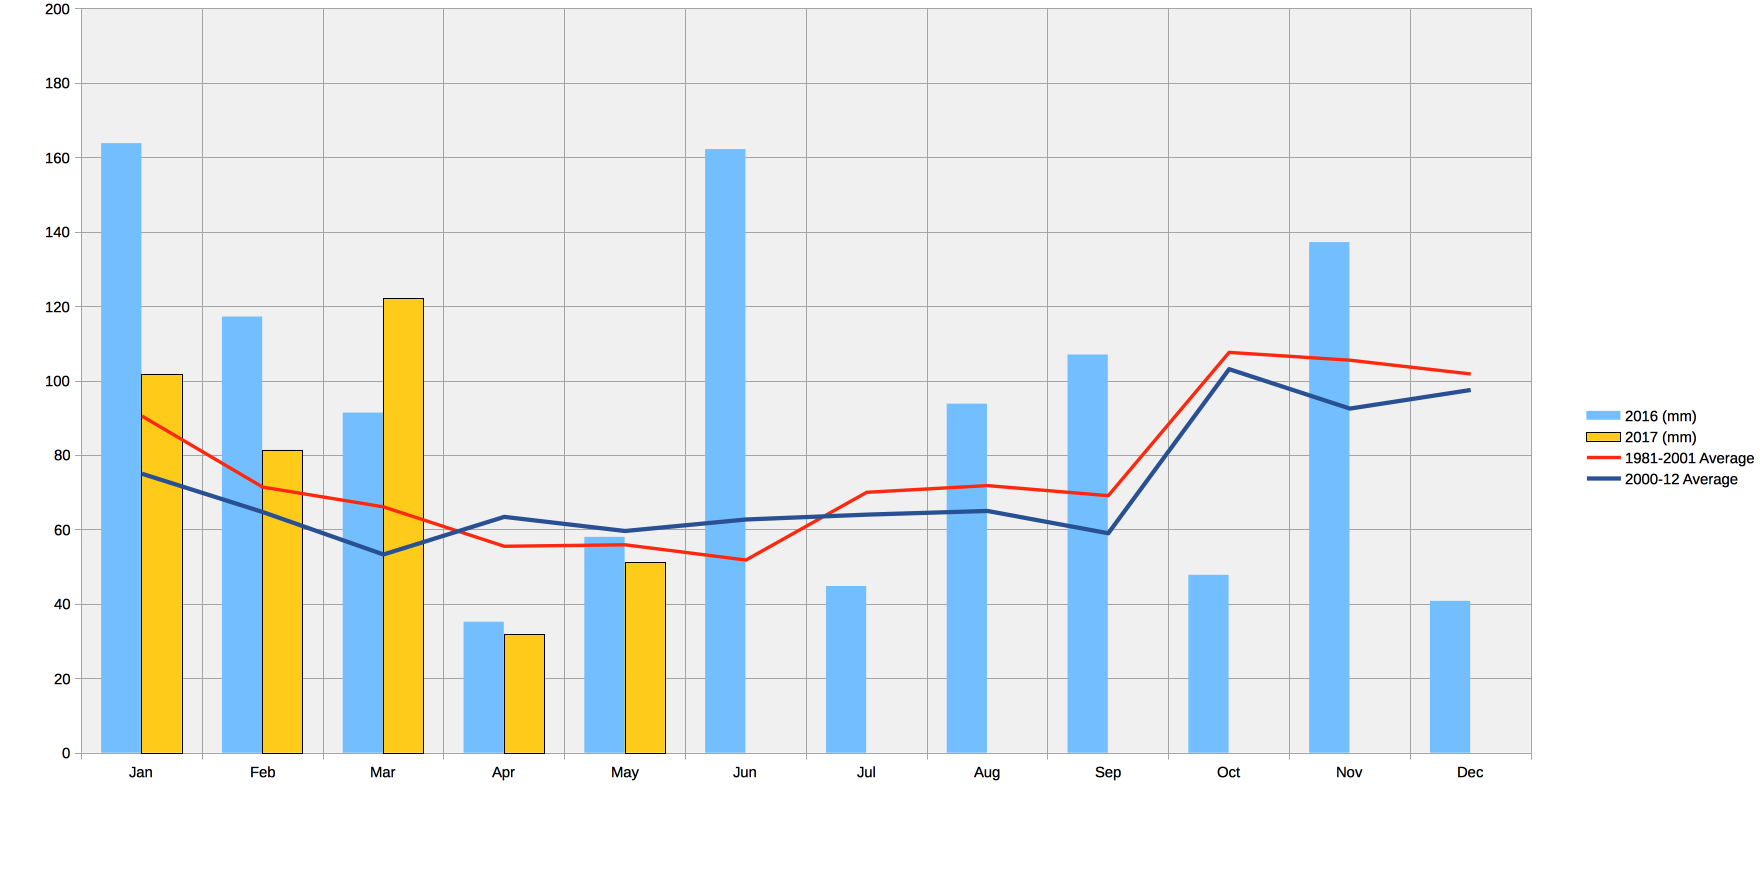
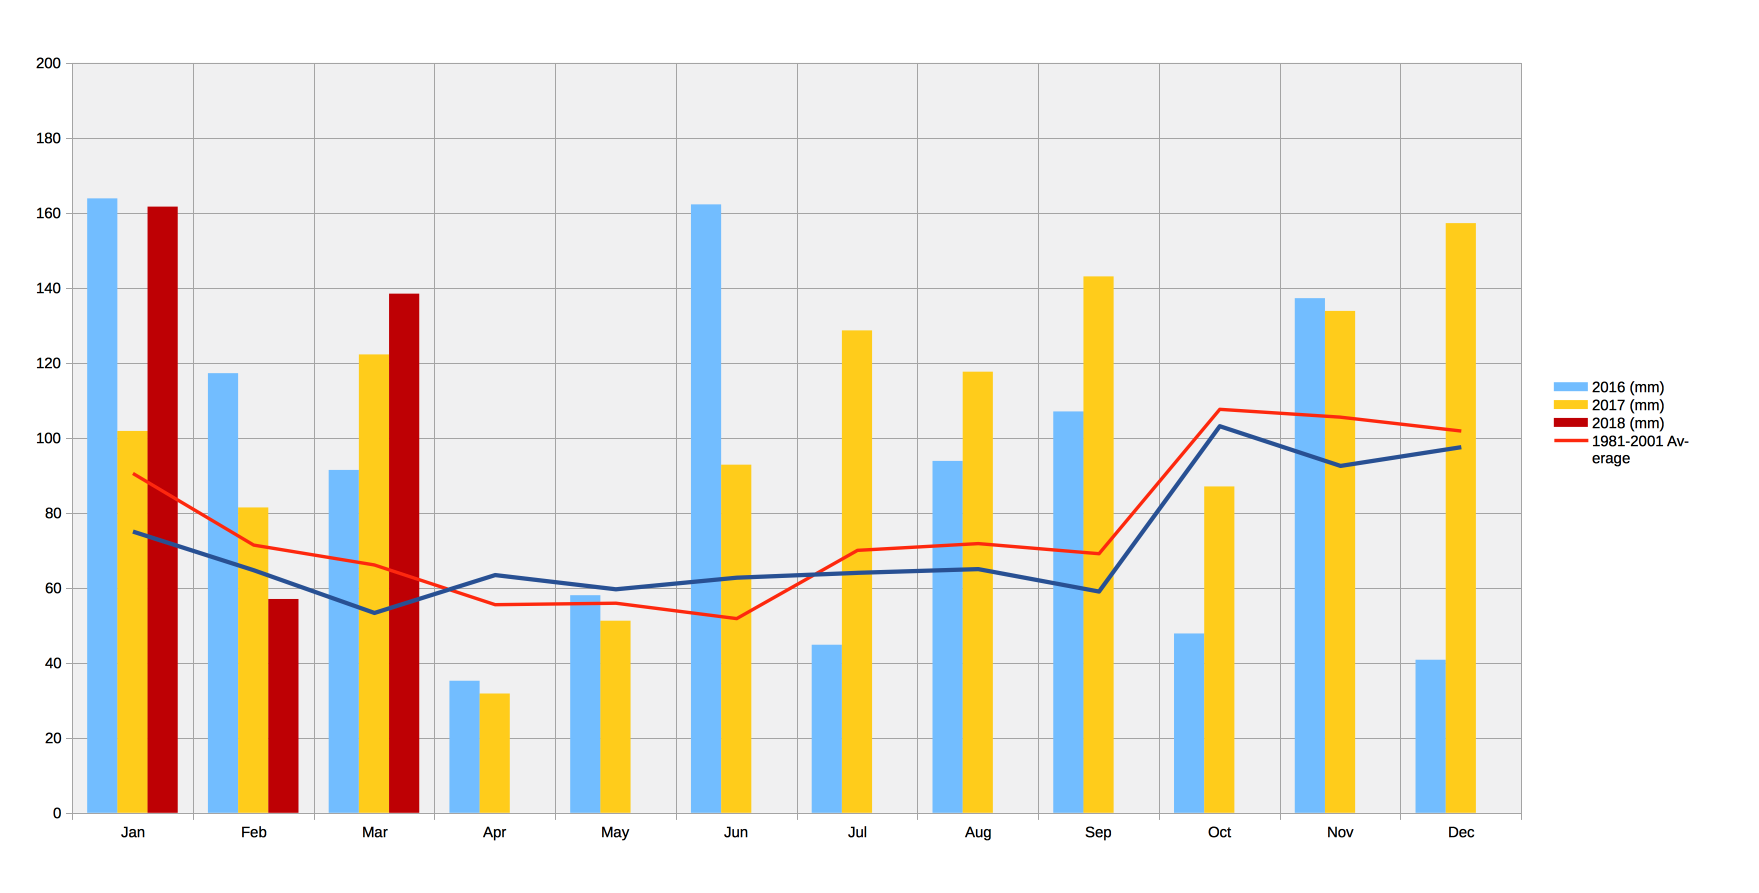
The first three months of 2018 have been distinctly wet, with a total of 357mm of rain, amounting to 185% of the 2000-12 average.  The graph below shows the pattern.

January

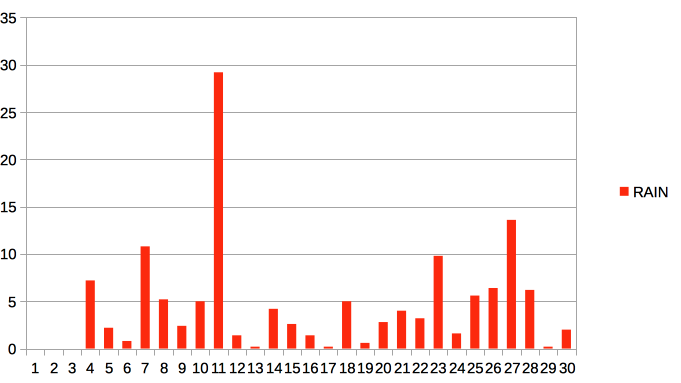
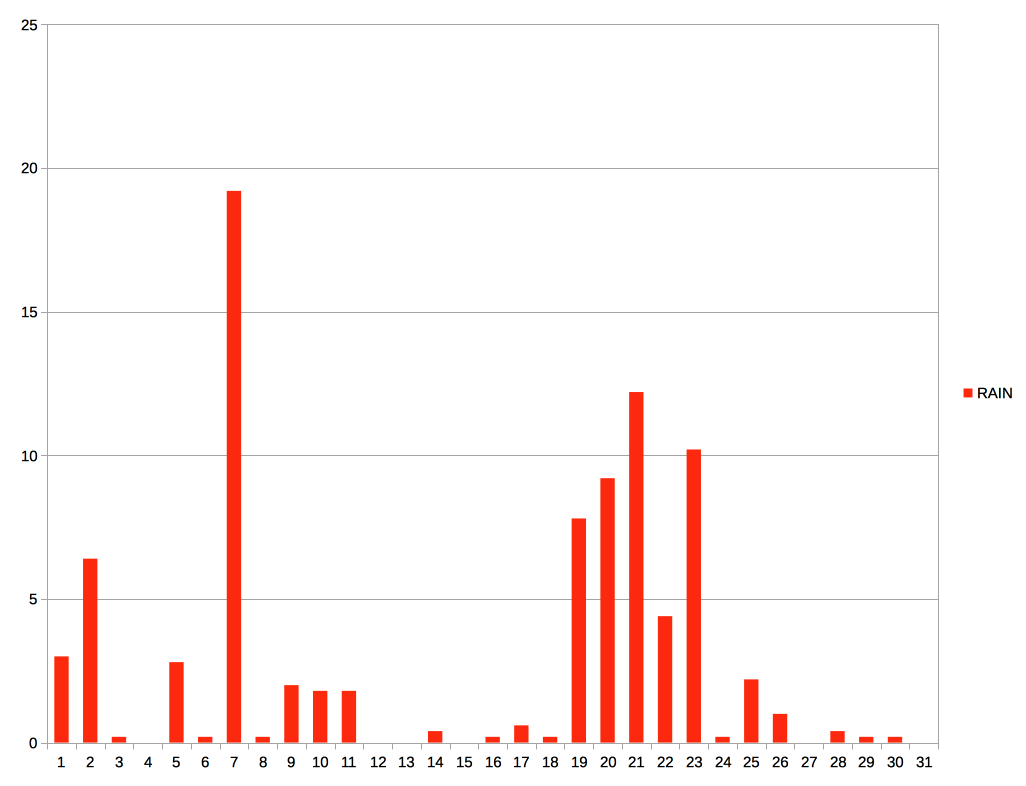
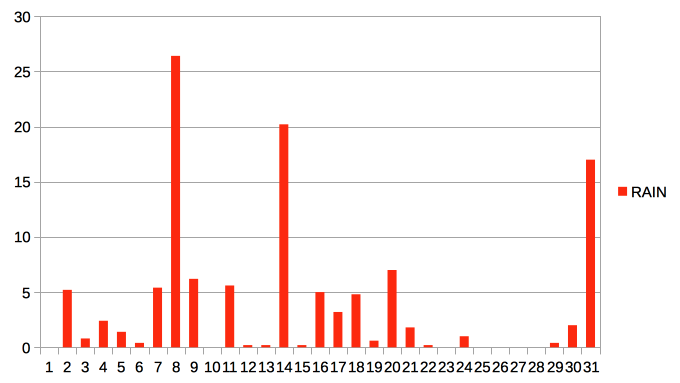
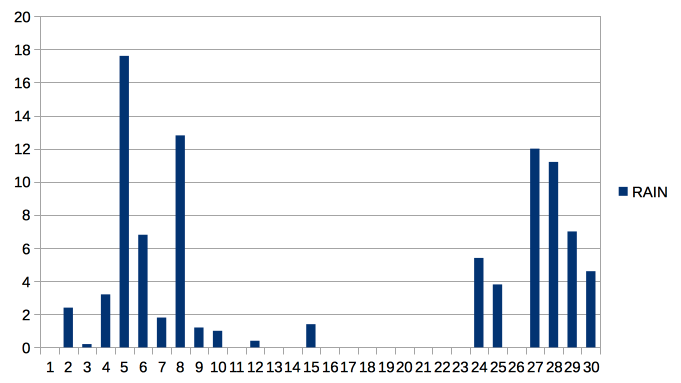
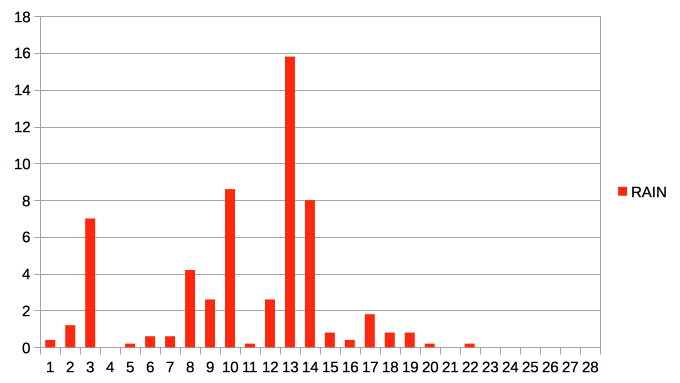
Total rainfall for January was 161.6mm, or 215% of the 2000-12 average.  As the graph shows, the middle of the month was dry, but heavy rain from the 15th on accounted for the high total.

February

February was drier than average, with only 57mm of rain, or 88% of the average.  The last 10 days of the month were notably dry – a hosepipe ban looked like a real possibility!

March

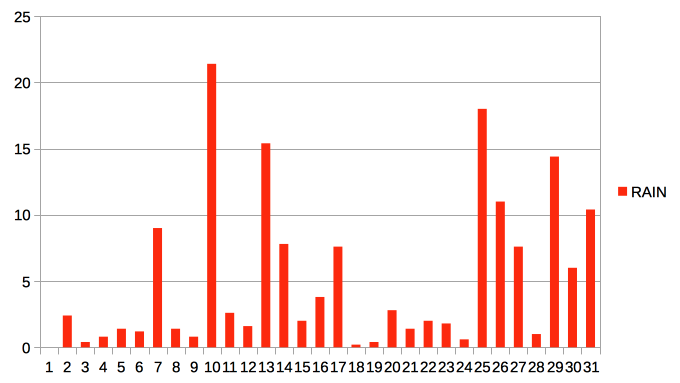
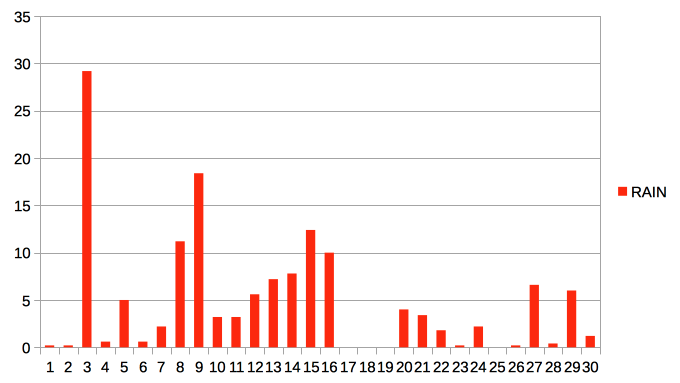
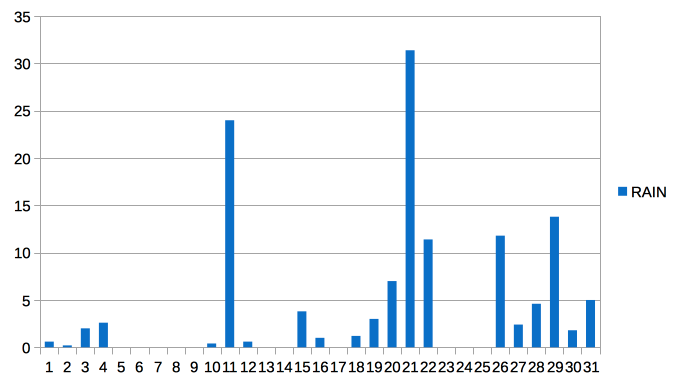
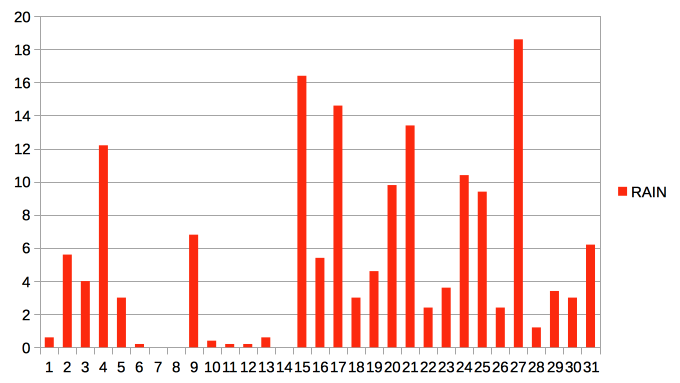
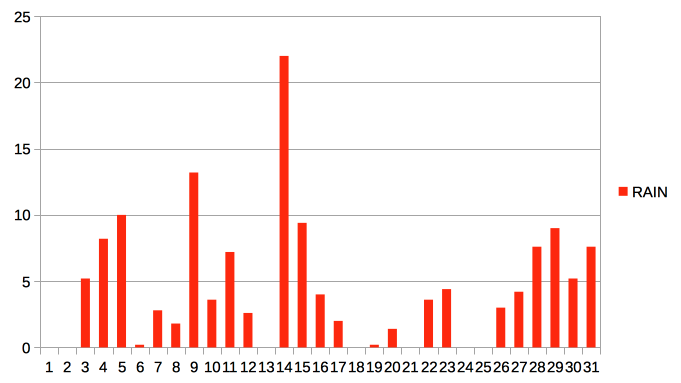
March more than compensated for February’s low rainfall, with 138mm of rain, or 259% of the average.  Most marked was the 14th of the  month, when 22mm of rain fell in 24 hours.

Rainfall for November and December, and 2017 summary

A little late in the day (or very late for November), the rainfall records for November and December 2017 show still more wet months.

Total rainfall for November was 133.8mm, 144% of the 2001-12 average, spread through the month.

The total for December was 157.2mm, 161% of the 2001-12 aveage and nearly four times the rainfall for December 2016.

Both November and December had some very wet days, with over 10mm of rain per day.

The annual summary graph shows what a wet year 2017 has been, with only three months with below average rainfall, and several months with substantially more than average.

The annual total for 2017 was 1248mm, which is 145% of the 2001-12 average.


Rainfall for October

October was a relatively dry month, with 87mm of rainfall.  This is 84% of the 2000-12 average.

This contrasts with the last few months that have all been substantially wetter than average.

There was a wet spell around the 20th of the month, but otherwise no particular pattern.  The high rainfall on 7th October was associated with Storm Brian.

Rainfall for July

July was another wet month, with double the 2000-12 average, at 128.6mm.  Here is the cumulative graph for the year to date:

The rainfall figures are distorted somewhat by a few extremely wet days, as shown in the graph for the month:

Nearly 25mm fell on 11th, and over 30mm on 21st, accounting for over a third of the total for the month.

Rainfall for June

Better late than never, here are the rainfall figures from the weather station for June 2017.  It looks from the monthly total (92.8mm) that June was a wet month – the average is 62.8mm.  Here is the cumulative data for the year to June.  2017 was notably drier than 2016, but still had substantially more rain than average.  The daily figures for June –

show a dry middle to the month, after a fairly wet start, and followed by a distinctly damp end.