Jan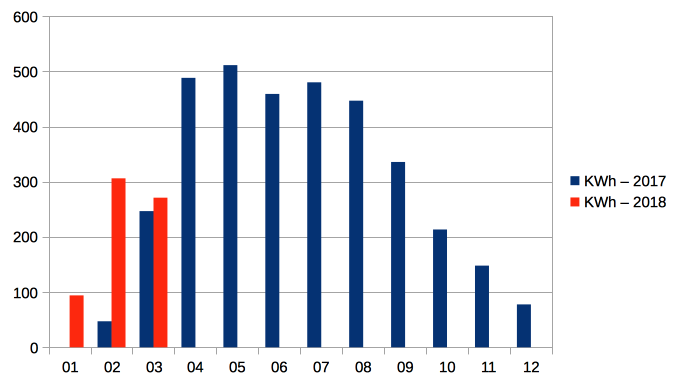 Our solar panels have generated 671kWh in the first three months of the year, reasonably consistent with the expected annual profile.
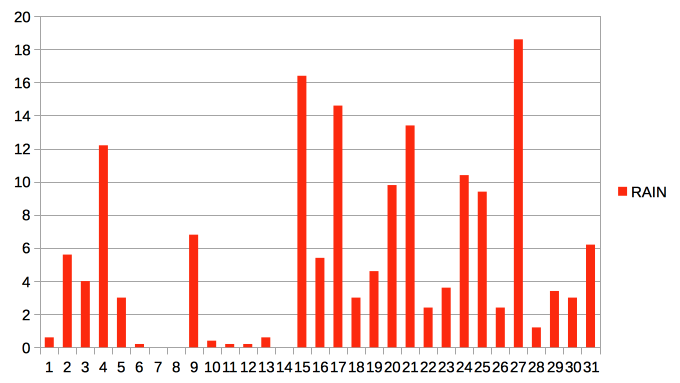
January
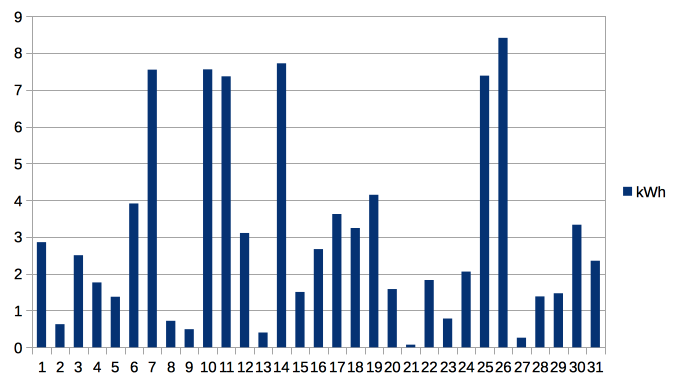 January was patchy, with a few reasonable days. We have no comparison with previous years for the monthly total of 94kWh, as the system was not installed until February 2017.
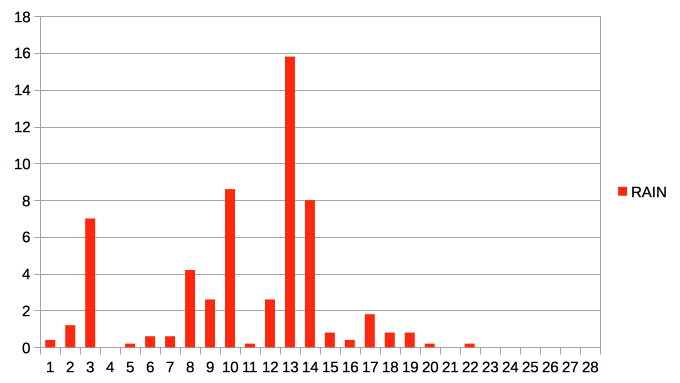
February
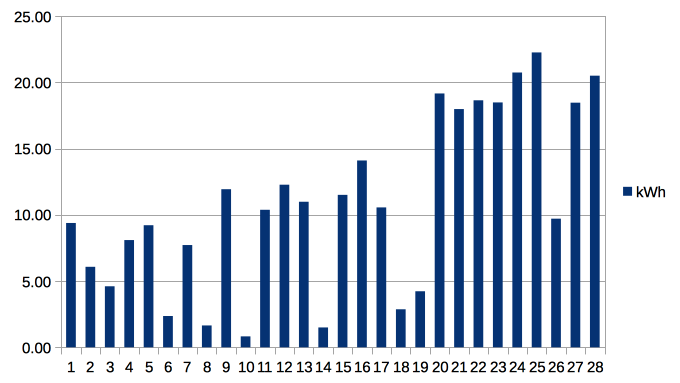 The latter half of February in particular was sunny, contributing to a monthly total of 306kWh, with several days over 20kWh. Again, no year-on-year comparison is possible.
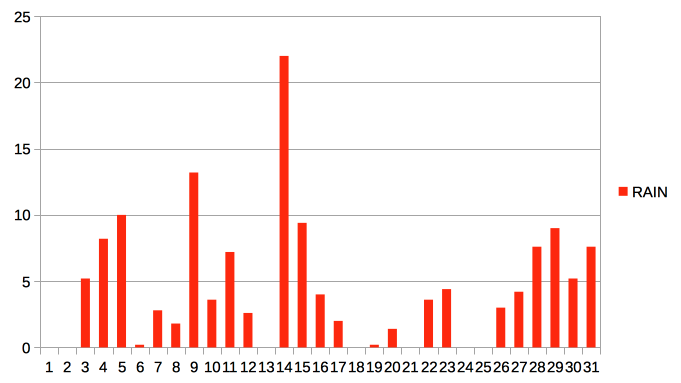
March
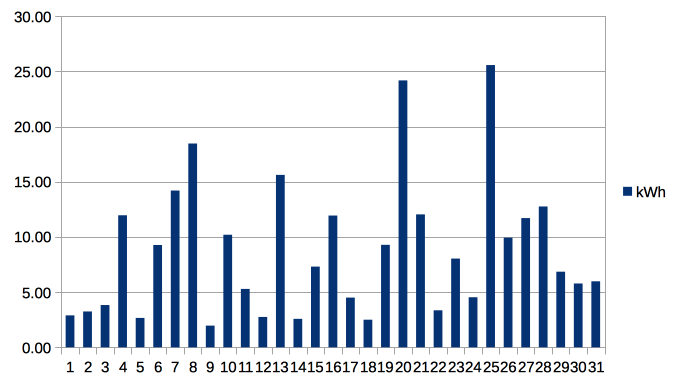 The total for March was 271kWh, slightly greater than March 2017. A few good days, including one at more than 25kWh helped.